Welcome to Causal Analysis!
I hope the Unsupervised Learning narrator didn't say anything too mean to you while you were over there. Oh, you came to me first? That's awfully kind of you :). Anyway, enough blabbing around, let's dive straight in!
From our pre-processing, we defined the key terms of our main question, the features and the character tropes.
In this chapter, we are opting for a more causal approach.
In other words, given an input X, we can find the output y via a function f(X), with f(X) being the main mystery.
We can apply this approach to our case and define our input X as the set of features we defined a chapter ago and our output y as our 16 unique character tropes.
We would like to "learn" the function f that links the two such that f(X) = y.
Who knows? We might even be able to have fun after having found this function, like figure out what kind of trope I would play!
As we have a discrete y, each character trope represents a separate and independent category, we have to go with classification.
We will go through various methods to find our f(X).
Let's start with Decision Trees!
A Tree of Decisions
We had the choice between kNN or Decisions Trees as our preferred algorithm of classification. We played around with both, testing them on our features and after seeing our results we opted for a decision tree. Yay! Now that we planted our tree, what's so special about it?
To answer briefly, the F1-score... amongst other things but I'll save that for later.
The F1-score is a measure of predictive performance.
And so in our case, the higher the F1-score, the better our classification algorithm can find a pattern of features that best describe our tropes.
We compute the F1-score for each of our 16 character tropes and get the following table:
Tropes
F1-Score
charismatic_charmer0.36
crazy_fighter0.13
crazy_jealous_guy0.10
dumb_and_clumsy0.26
emotional_damage0.24
evil_character0.05
jock0.26
laidback_freebird0.50
loser0.09
mean_officer0.09
old_wise_quirky0.23
respected_leader0.21
shallow_and_popular0.39
sidekick0.15
skilled_badass0.13
tech_genius0.15
As said above, a high F1-score means that the model has a good balance at not only identifying most of the true tropes but also maintaining a low rate of false positives.
We can observe laidback_freebird as a trope with seemingly distinctive features.
As such, to select the tropes that are best described by our model, we set a F1-score threshold of 0.20. We know that the F1-scores are fairly low but this can be due to our small dataset in terms of actors per tropes as well as low number of features extracted compared to an human eye. This allows us to focus our energy on the tropes where the link between features and trope is strong and statistically significant, potentially leading to more confident insights into Hollywood's typecasting patterns. We select the following tropes:
charimastic_charmerjockdumb_and_clumsyemotional_damagelaidback_freebirdold_wise_quirkyshallow_and_popularrespected_leader
Individual Model Training
We now have 8 character tropes of interest. After a multi-class approach in the step above, I think these each tropes are craving a bit of one-on-one attention. Turns out there was more than just the F1-score that was important about our decision tree (Shocker, right?!). The decision tree gives us another delicious fruit, as it evaluates the importance of each feature, defined previously in our pre-processing step, for each trope.
We can visualise these results in this nice heat map:
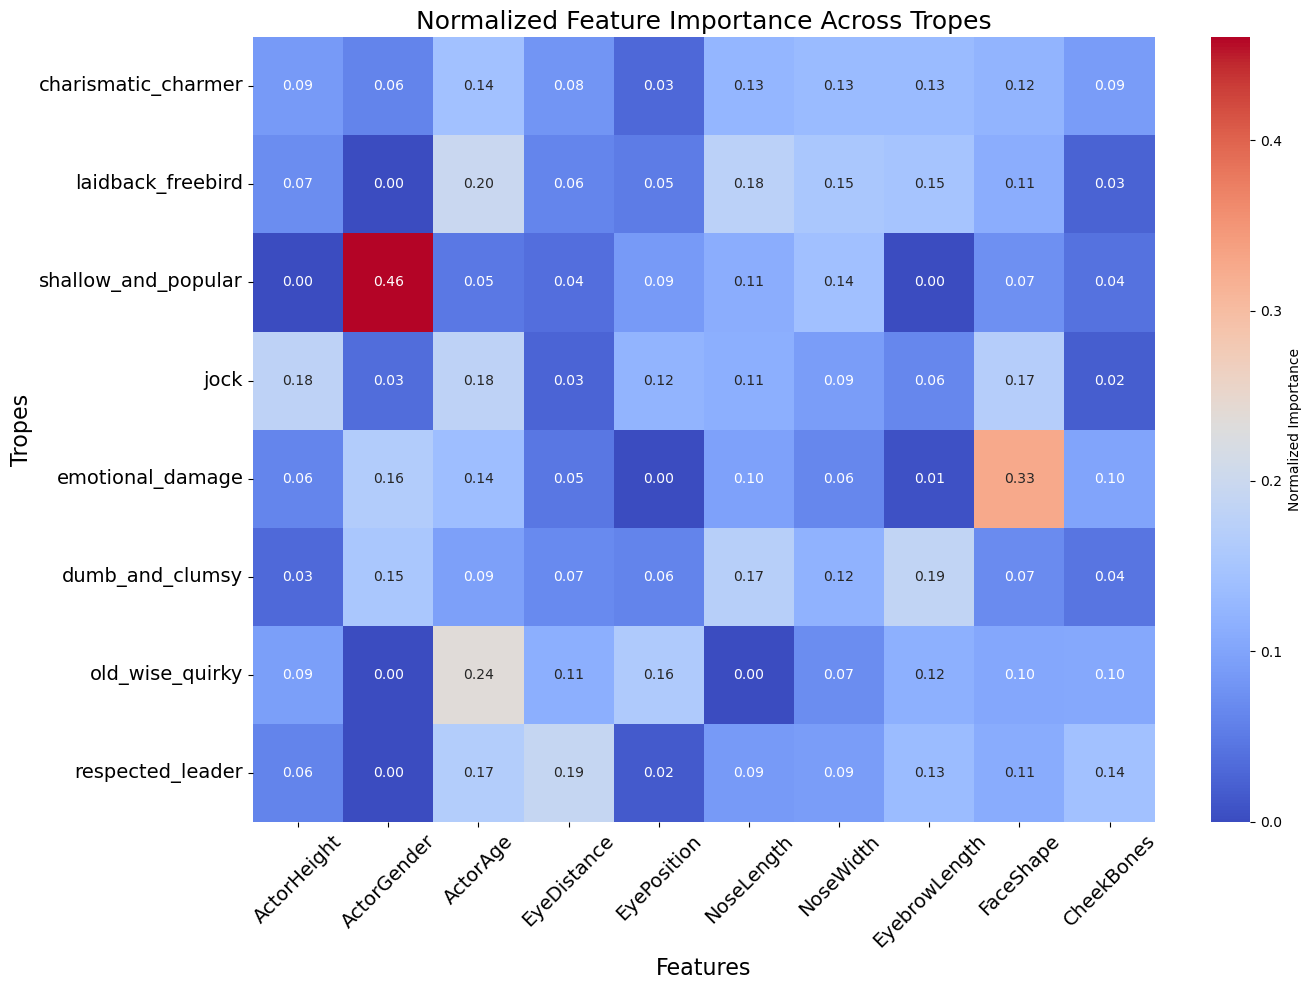
There's quite a bit of interesting results to pick from this heat map. Note that the redder the box, the more important the feature is for that trope, the bluer, the less important it is. Let's have a look at the most notable results.
For the shallow_and_popular trope, we see that being a woman is a very important feature (we set 1 as female and 0 as male).
I wonder if the unsupervised learning narrator has something to say about...
We also observe that you need to be old to play the old_wise_quirky trope that was not really much of a surprise, but I'd still appreciate an audible gasp of shock).
A really interesting one is for the emotional_damage trope with a high value for the Face Shape feature.
Perhaps, this could suggest that actors with a rounder face shape are more likely to play the emotional_damage trope.
We should note that the values between 0.18 and 0.20 are still fairly high (despite being very blue) as it could more be a sum of various features that particularly define a trope rather than just one.
Take for example the jock, we identify Actor Height, Actor Age and Face Height as important features.
However, we notice that for some tropes, features seem to have little to no importance.
We're looking at you respected_leader...
As such, to delve deeper into our results, we evaluate the statistical significance of each feature for each trope, to make sure they actually mean something.
We confirm our result from above about the respected_leader trope as the p-values for each features for this particular archetype are absurdly high.
So for each trope, we only plotted the coefficients of their statistically significant features so don't be surprised when some features and tropes seem to dissapear!).
Please note that we separated the ActorGender variable into two, one for female and one for male.
To wrap things up, we were able to identify which features were prevalent in certain tropes.
This gives weight behind our suggestions that actors with particular features are best suited to play a specific character trope.
For example, an old actor should play the old_wise_quirky trope. Ok, not my best example but you get it.
I'll let you go pay a visit to my unsupervised learning narrator. Say hi to them for me!
Unsupervised Learning
Oh, so you didn't read me first. Well, can't do much about it now, can I? At least you did read my chapter, so thanks! Time to for you to hop to the conclusion just below now.